Vendor Performance
OnRamp allows you to track the following 3 core vendor metrics over a specified date range:
-
Vendor Price Accuracy
-
Vendor Quality by PPM
-
Vendor Delivery Performance
Vendor Performance Date Range
The date range for tracking vendor performance is set on Refresh Vendor Performance [S2674]. To update the vendor data to the latest information, click the Refresh Performance button.
Vendor Price Accuracy
The price accuracy metric matches your purchase order price to the vendor voucher invoice price. If these values match, that record receives a pass. The metric is calculated as the total extended value of the passes over the total extended value for all.
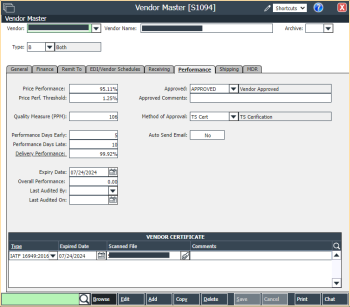
On Vendor Master [S1094] > Performance, set up the performance threshold percentage to give the order and voucher a pass/fail range. You can also view the vendor price performance on this screen.
For price accuracy, OnRamp doesn’t keep a historic record. So, any changes to the threshold may affect previous vouchers that had received a pass.
The pass/fail results can be viewed on the Vendor Price Performance Modifications [S2673] screen, where you can edit receipt history, in case an order was received but the order wasn't entered correctly. On the Receipt Details frame you can add a Purchase Order Adjustment that will correct if the record should pass or fail and add an error code to indicate the reason for the pass/ fail.
Reports
On the reports and dashboards, a price performance of 100% is perfect price accuracy, while a 0% means that the price quote has never matched the voucher price.
Vendor Price Performance Detail [R3189] provides a detailed view of the vendor price performance. This report will display the customer, the part, the voucher number, the quantity, the price difference percentage, and if the price passes or fails.
Vendor Price Performance Summary [R3190] displays a summary of the price performance. This report will give you the past 12 months of purchases and the forecast 12 months in dollar value. This report can also be sorted by the percentage result, so you can quickly see which vendors are more accurate with their pricing.
Dashboard
The Vendor Price Performance [D1232] dashboard allows you to review the top 10 worst vendors by their price accuracy.
Vendor Quality by PPM
This metric takes the total rejected quantity divided by the total quantity received per million. The value is recorded on the Supplier Rejection [S2375] screen where the receiving team enters the quantity rejected when receiving an order. .
This value, the PPM, will also appear on the Vendor Master [S1094] screen for the vendor under the Performance tab.
PPM is calculated automatically based on MDRs![]() submitted for the vendor, so there is nothing to set.
submitted for the vendor, so there is nothing to set.
Reports
You can view a summary of the rejected values on the Vendor PPM [R4334] report. The values are summarized into the past 12 month part value and the future 12 month part value. Also, you can sort the report by the vendor PPM value, allowing you to quickly see which vendors are delivering lower quality material.
The Open and Closed MDRs [R1090] report will give you the detail of the number of parts rejected per submitted MDR form.
Dashboards
The High PPM Vendor [D1231] dashboard was added to OnRamp ERP to quickly show you the top 10 vendors by their PPM value.
Vendor Delivery Performance
The delivery performance metric is a percentage calculated as the total quality delivered on time divided by the total quantity received.
When the purchase order line item is received into inventory, or the order is closed, a receipt is saved with the order due date and the dates for when the items were received. OnRamp then takes these values to calculate the vendor deliver percentage.
To track delivery performance, on the Vendor Master [S1094] > Performance tab, you must setup the Performance Days Early and Performance Days Late fields. Once these fields are set OnRamp calculates the delivery percentage, which is displayed in Delivery Performance, based on when the order line item is received when compared to the order due date.
The order receipt history can be seen on Vendor Delivery Performance Modifications [S2074]. On this screen, a green check mark signifies that an item has been received and allocated to the listed time category: Early, On Time, or Late.
In the event that an order is not received correctly, you can use screen 2074 to correct entries. On the Receipt Details frame, you can further specify the reason for the entry by adding the Reason Code.
Reports
On the reports and dashboards, a delivery performance of 100% means that all deliveries from the vendor have been received within the delivery range, while 0% means that the vendor has never delivered an order on time.
Vendor Delivery Performance Detail [R3169] shows you a detailed view of the vendor delivery information. This report displays the performance code, the received quantity, and if the delivery was early, late, or on time. If the delivery was early or late, the report also displays the number of days from the delivery date.
Vendor Delivery Performance Summary [R5002] displays a summary of the performance. Here, you can view the dollar value received over the past 12 months and a forecast of the future 12 month part dollar value along with the early, late, and on time quantities and percentages. Report 5002 also allows you to sort the vendor list by various factors, including their on-time percentage. This means that you can get a better view of your worst performing vendors faster.
Dashboards
The Vendor Delivery Performance [D1230] dashboard allows you to quickly view your worst 10 performers by their delivery performance percentage.
Auditing Vendor Performance
You can use the OnRamp Audit module to setup scheduled audits for your vendors. On these audits, the vendor performance scores will be automatically added to the audit.


